
Cash-on-Cash Return for Distressed Property Deals
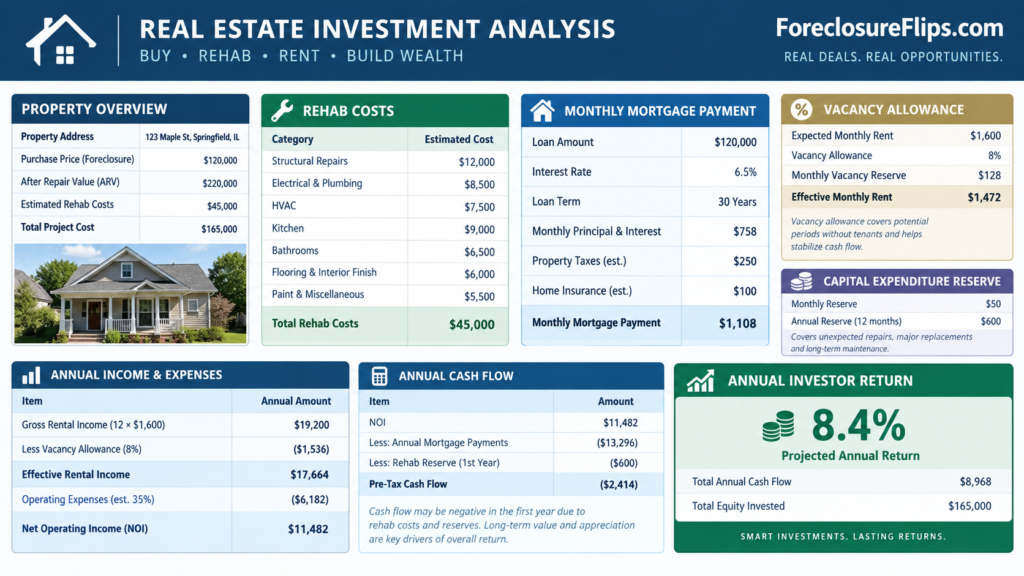
A distressed rental can look like a 12% cash-yield deal before closing and finish its first year closer to 7%. The formula did not fail. Its inputs changed.
Rehab runs over budget. Lease-up takes longer than expected. Financing costs more than the original quote, and reserves keep additional cash tied to the property.
That is where cash-on-cash return real estate analysis earns its place in distressed-property underwriting. It shows how much annual pre-tax cash flow the property produces relative to the cash actually committed to the investment.
Get Foreclosure Investing Insights Twice a Week
Subscribe to the Foreclosure Flips newsletter for practical ideas on finding deals, analyzing opportunities, and understanding foreclosure-related investing strategies. We send concise updates twice a week so you can stay informed without adding more noise to your inbox.
What Cash-on-Cash Return Actually Measures
Cash-on-cash return compares annual pre-tax cash flow with the investor’s cash invested in the property:
Cash-on-cash return = annual pre-tax cash flow ÷ total cash invested
Stessa’s rental-property return guidance uses the same basic formula and distinguishes cash-on-cash return from cap rate and broader return-on-investment measures.
For a distressed acquisition, the denominator can include more than the down payment. Buyer closing costs, rehab cash, loan points, carrying costs during construction, and property reserves may all represent investor capital committed before the rental produces stable income.
Projected return
The projected return uses underwriting assumptions before closing. It shows what the property should produce if the renovation, rent, vacancy, expenses, and financing perform as expected.
Stabilized return
The stabilized return reflects a normal operating year after rehab and lease-up. It removes the temporary disruption of construction and initial vacancy.
Realized return
The realized return uses actual cash invested and actual pre-tax cash flow over a completed period. This version shows what the investment produced rather than what the original spreadsheet expected.
One Distressed Rental Can Produce Three Different Results
Consider a property purchased for $160,000 with financing. The plan calls for a $30,000 renovation followed by a long-term rental at $2,500 per month.
| Cash invested | Amount |
|---|---|
| Down payment | $40,000 |
| Buyer closing costs | $5,000 |
| Rehab cash | $30,000 |
| Loan points and financing fees | $3,000 |
| Property reserve | $7,000 |
| Total cash committed | $85,000 |
Once stabilized, the annual operating projection is:
| Annual cash-flow item | Amount |
|---|---|
| Scheduled rent | $30,000 |
| Vacancy allowance | -$1,500 |
| Property taxes | -$3,600 |
| Insurance | -$1,800 |
| Maintenance | -$1,800 |
| Management | -$2,280 |
| Owner-paid utilities and miscellaneous | -$720 |
| Debt service | -$10,800 |
| Pre-tax cash flow | $7,500 |
The stabilized cash-on-cash return is about 8.8%.
That number is useful, but it is not yet the investor’s first-year experience. Distressed properties often create their largest deviations before and shortly after rent begins.
Rehab Overruns Reduce the Return Before Rent Starts
Suppose hidden plumbing damage adds $8,000 to the renovation. Total cash committed rises from $85,000 to $93,000.
If stabilized pre-tax cash flow remains $7,500, the return falls to about 8.1%.
The overrun can also extend the construction schedule. One extra month adds interest, taxes, insurance, utilities, and other carrying expenses while rent remains at zero.
This is why rehab affects cash yield twice: more capital goes into the property and income may start later.
The IRS Residential Rental Property guidance lists common rental expenses such as mortgage interest, insurance, management fees, repairs, taxes, and utilities. It also separates repairs from capital improvements for tax purposes.
Tax accounting and cash-on-cash analysis serve different purposes. A capital improvement may be recovered over time for tax purposes, but the investor’s cash leaves the account when the work is paid for.
Vacancy Can Turn a Strong Pro Forma Into an Average Year
A stabilized model usually includes a vacancy allowance. The actual timing of vacancy can create a different first-year result.
Assume the property takes six weeks longer to lease than expected. Later in the year, turnover adds cleaning, paint, utilities, and leasing expense.
Annual pre-tax cash flow falls from the projected $7,500 to $5,900. On the original $85,000 cash commitment, the realized return drops to about 6.9%.
The acquisition price did not change. Rent may still reach $2,500 when occupied. The lower return comes from the number of months the property actually produced income and the cash required to reach or restore occupancy.
Distressed rentals can carry extra lease-up uncertainty because contractor delays, permits, inspections, or utility restoration can shift the first rent date.
Financing Can Improve or Weaken the Cash Yield
Leverage reduces the amount of investor cash required to buy a property, which can improve cash-on-cash return. Debt service works in the opposite direction by reducing annual cash flow.
| Financing choice | Lower leverage | Higher leverage |
|---|---|---|
| Cash invested | $110,000 | $85,000 |
| Annual debt service | $7,800 | $10,800 |
| Pre-tax cash flow | $10,500 | $7,500 |
| Cash-on-cash return | 9.5% | 8.8% |
In this example, putting less cash into the property does not create the higher percentage because additional debt service absorbs more of the rental income.
A different interest rate, amortization period, or loan balance could reverse the outcome. Actual loan terms provide a better comparison than the assumption that maximum leverage automatically improves yield.
Distressed acquisitions can also add hard-money interest, points, draw fees, extension charges, and later refinance costs.
Reserves Change How Much Capital Is Really Committed
A reserve is not the same as an expense. The money remains available until the property needs it.
Still, a dedicated reserve may not be available for the next acquisition, which makes it relevant when evaluating how much capital the investment ties up.
Removing the $7,000 reserve from the example lowers cash invested from $85,000 to $78,000. The same $7,500 stabilized cash flow then produces a 9.6% return instead of 8.8%.
Both calculations can be useful when the method stays consistent. One measures yield on cash already spent; the other measures yield on all capital assigned to the property.
For portfolio planning, the second view can better reflect how much money the rental keeps out of other deals.
Year-One Return and Stabilized Return Answer Different Questions
A property purchased in January may spend four months under renovation, another month in lease-up, and only seven months collecting rent.
Annualizing those seven months can show how the property may perform when stabilized. It does not describe what happened during the first 12 months.
That creates two useful figures:
Stabilized return: expected annual pre-tax cash flow in a normal operating year divided by stabilized cash invested.
Year-one realized return: actual first-year pre-tax cash flow divided by actual cash invested during that period.
A BRRRR deal adds another wrinkle. Refinancing can return some of the original capital and lower the denominator, while the permanent loan changes debt service. The cash-on-cash return real estate calculation after refinance may therefore look very different from the return measured during acquisition and rehab.
Cash-on-Cash Return Is Not Cap Rate
Cap rate evaluates the property before financing:
Cap rate = net operating income ÷ property value or purchase price
Cash-on-cash return includes financing because debt service affects pre-tax cash flow and the down payment affects investor cash.
A property can have a healthy cap rate and a weak cash-on-cash return when expensive financing absorbs too much operating income. Another can show a stronger cash yield because favorable debt terms reduce the cash required.
Cap rate helps describe the property’s operating economics. Cash-on-cash return shows what the invested cash is producing under the chosen financing structure.
What the Percentage Leaves Out
Cash-on-cash return focuses on current cash yield. It does not capture every source of real estate return.
Principal paydown increases equity without appearing as spendable cash flow. Appreciation can raise property value without increasing current income. Depreciation can affect after-tax results even though the calculation uses pre-tax cash flow.
Capital expenditures deserve separate attention as well. A new roof paid during acquisition may lower the initial percentage while reducing near-term repair risk. By contrast, a higher-yield property with an aging roof, sewer line, and HVAC system may face the opposite problem.
That is why a single percentage cannot rank every rental by itself.
What a Weak Return Can Reveal About the Deal
The value of cash-on-cash return real estate analysis is not limited to comparing percentages. A weaker-than-expected result can identify where the underwriting broke down.
If cash invested rose sharply, the cause may be rehab scope, closing costs, or financing fees. When annual cash flow falls, rent, vacancy, operating expenses, or debt service may be responsible.
Comparing the original projection with the stabilized and realized figures turns the metric into a useful diagnostic. In that role, cash-on-cash return real estate analysis shows whether the shortfall came from the property, the financing, or the amount of cash required to stabilize it.
A distressed rental projected at 10% that stabilizes at 8% may still be a strong investment. What caused the two-point difference tells you more than the percentage alone.
The Return Is Only as Accurate as the Cash Behind It
A cash-on-cash percentage becomes misleading when the analysis counts only the down payment but ignores rehab cash, financing fees, lease-up costs, or reserves tied to the property.
A stronger calculation starts with the actual capital committed and realistic cash flow after vacancy, operating expenses, and debt service.
For distressed rentals, that often produces a lower number than the headline projection. It also produces a more useful one.
A return built on complete costs gives you a clearer view of what the property is paying on the cash invested—and how much room remains when rehab, vacancy, financing, or repairs do not follow the original plan.
You might also like:
 How To Build Real Wealth With a New Construction Rental Portfolio
 BRRRR Investing: How to Buy, Rehab, Rent, Refinance, and Repeat
 Rent-to-Own as an Exit Strategy for Investors
 Risks of Rent-to-Own Deals for Property Investors
 Lease Purchase vs Rent-to-Own for Real Estate Investors
 How Debt to Income Ratio Affects Property Investors